A Bayesian network model to predict fish acute toxicity from multiple lines of evidence
By: Jannicke Moe, Adam Lillicrap (Norwegian Institute for Water Research), and Raoul Wolf (Norwegian Geotechnical Institute)
WWW: Anders L Madsen, Mark Christiansen (HUGIN EXPERT)
Latest update: January 2023
Bayesian networks (BNs) are gaining popularity in ecotoxicology and ecological risk assessment, because of their ability to integrate different types of data and other information, and to predict the probability of specified states. This example demonstrates the use of a Bayesian network to provide scientific support for decisions on animal testing in ecotoxicology. European legislations require Reduction, Replacement or Refinement of animal testing wherever possible. The use of fish embryos for toxicity testing is considered a promising alternative to the use of juvenile or adult fish. However, fish embryos are not yet accepted as an alternative for regulatory purposes. The European Chemicals Agency (ECHA) has therefore recommended the development of a weight-of-evidence (WoE) approach to evaluate Fish Embyo Toxicity (FET) data in combination with other types of information as a replacement for juvenile fish toxicity data.
We have developed a probabilistic WoE model: a BN to predict the acute toxicity of a substance to juvenile fish based on four lines of evidence (Figure 1). The purposes of this online demonstration version are:
- To demonstrate the functionality of the model by the example substances given below
- To let users predict juvenile fish toxicity for new substances by entering their own data.
- To get feedback from users for improvement of the tool.
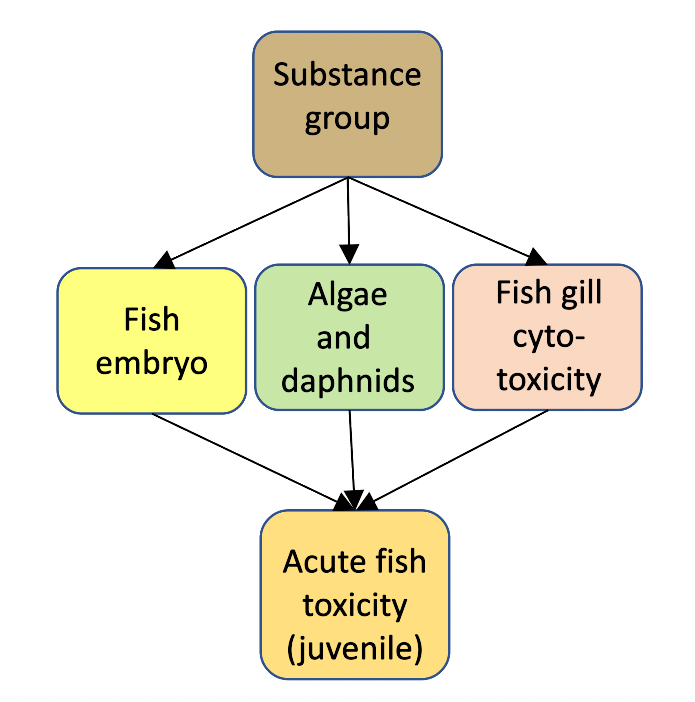
Figure 1.
The definition of substance groups are based on of the following input nodes representing physcial and chemical properties of substances.
- Physical and chemical properties of the substance:
- Hydrophobicity (the octanol-water partition coefficient, Kow): low (<5.5) or high (>5.5)
- Molecular weight (g/mol): low (<= 600), medium (300-600) or high (>600)
- Mode of Action (N=narcotics, S=specific acting, U=unclassified)
The three lines of evidence are based on the following input nodes
- Toxicity of the substance's chemical category (to juvenile fish)
- Chemical category (select from the list)
- Toxicity of the substance to other species (algae and daphnids)
- Toxicity to algae: 5 toxicity levels (Table 1)
- Toxicity to daphnids: 5 toxicity levels (see Table 1)
- Ratio of EC50 to daphnids/algae: low (<0.5), medium (0.5-2) or high >2
- Toxicity of the substance to fish embryo
- Observed toxicity to fish embryo: 5 toxicity levels (Table 1).
QSAR (quantitative structure-activity relationship) predictions are as additional information (prior probability))
The levels of all toxicity nodes are defined by the following intervals of LC50 or EC50 values:
| Toxicity level | Lower concentration (mg/L) | Upper concentration (mg/L) |
|---|---|---|
| extremely low | 1000 | inf |
| very low | 100 | 1000 |
| low | 10 | 100 |
| medium | 1 | 10 |
| high | 0.1 | 1 |
| very high | 0.01 | 0.1 |
| extremely high | 0 | 0.01 |
The three lines of evidence are weighted according to a linear regression analysis with cross-validation in this version in the model: embryo 43 pct, algea and daphnids 49 pct, gill cytotoxity 8%. The development, testing and validation of an earlier version of this model are further described by [Moe et al., 2020].
For a given chemical substance, please enter the substance name and the requested values for each of the input nodes.
One value can be entered for each of these nodes:
- Mandatory: molecular weight, hydrophobicity, mode of action
- Optional: QSAR, whole-body fish biotransformation, touch-evoke response
Up to ten values can be entered for each of the nodes algae, daphnids, fish embryo (all mandatory) and gill cytotoxicity (optional).
All toxicity data (EC50 and LC50) should be entered with unit mg/L. The values will be transformed to the scale mol/L (log10) by the model for calculations.
The entered values will be displayed on the page labelled Show entered data.
The model predictions will be displayed on the page labelled Results.
In case of an error message, reload the page (it may be necessary to enforce a complete reload, e.g., on Windows using shift-F5).
Name and organisation
Author name:
Report made by:
Substance
Substance name (chemical):
Entering data to the system
Data can be entered in two alternative ways: (a) fill in a template and upload, or (b) enter data manually.
Option (a): Upload data from file
Download template data file for uploading data from file: XLSX template file. Be sure to adhere to the format of the template file.
Please note that no cell in the file must contain semicolon.
Use the button below to select and upload data from the filled-in template.
Option (b): Input data manually
Use the button below to enter data manually to the system. A new window should occur.
Notice: The data is sent to the server for calculations, but the data is not stored. Once the Reset button is pressed, the data is removed from the model.
A new window should appear. If this window does not occur, then your browser may have blocked popup windows or your are not using a secure connection (you must use https and not http).
Reset
Use the reset button to reset the calculation and remove any information on a substance from the model. This should be done before considering a new substance.
Examples
Example for four different substances can be loaded using the button belows.
The delimiter ';' must be chosen in the pop-up window to load the example files correctly.
For example, for the substance, the model correctly predicts that the toxicity to juvenile fish most likely is low (56% probability), although the measured toxicity to embryo is very low. In this example, the assessment based on the BN model with four lines of evidence is closer to the actual toxicity to juveniles, than an assessment based only on measured toxicity to embryos would be.
A new window showing the content of the example file should appear. If this window does not occur, then your browser may have blocked popup windows
Press Reset between loading different cases.
Example XLSX-files
Endrin - XLSX file.
Triclosan - XLSX file.
Carbamazepine - XLSX file.
Allyl alcohol - XLSX file.
Entered data
The pages below show the entered data as well as values derived directly from the entered data (e.g., the substance group). For all toxicity values (EC50 and LC50). The values are shown after transformation to the scale mol/L (log10).
Users are not supposed to enter or change values on the pages below.
Physical and chemical properties of the substance
The three nodes below define the substance group: molecular weight, hydrophobicity and Mode of action.
Substance group
Warning factors
Toxicity to algae and daphnids
Entered toxicity values as EC50 transformed to the scale mol/L, log10.
Selected number of values for toxicity to algae
Selected number of values for toxicity to daphnids
Toxicity to fish embryo
Entered toxicity values as LC50 transformed to the scale mol/L, log10.
Selected number of values for toxicity to embryo
Fish gill cytotoxicity
Entered toxicity values as EC50 transformed to the scale mol/L, log10
Selected number of values for toxicity to embryo
QSAR-predicted toxicity to fish
Entered toxicity values as LC50 transformed to the scale mol/L, log10.
Conclusions
According to the warning factors, there is % probability that the chemical substance is outside of the domain of applicability for this model. If the probability is high, then the user is advised to assess whether an AFT test is necessary in addition to the data entered here.
The most probable toxicity interval of is mg/L (% probability).
The cumulative probability of LC50 being below 1 mg/L is %.
The cumulative probability of LC50 being below 10 mg/L is %.
The measured endpoint most sensitive to is .
The model predicted mean of LC50 is mg/L.
Computed probability distributions
Select unit
Result: Predicted toxicity to juvenile fish
Toxicity to algae
Toxicity to daphnids
Toxicity of fish embryo
Fish gill cytotoxicity
The View input values button provides a table of the entered values, and some values calculated directly from these.
The View output values button provides a table of the predicted probability distributions for selected nodes, as displayed on this page.
The tables cannot be downloaded, but can be copied and pasted, e.g., into an Excel sheet.
Acknowledgements
We thank Scott E. Belanger, Kristin Connors and Jane Rawlings (Procter & Gamble) for providing data and knowledge for constructing, testing and validation of the model, and Wayne Landis (Western Washing University) for contributing to development of the model.
This work was supported by NIVA's research programme DigiSIS (New digital methods for monitoring and research) and by CEFIC LRI ECO51 - SWiFT: Strengthening weight of evidence for FET data to replace acute fish toxicity.
Contact Information
For further details on the paper: Jannicke Moe at jmo(at)niva(dot)no
For further details on the use of Bayesian networks and web deployment of models, contact: Anders L Madsen at alm(at)hugin(dot)com
References
[Moe et al. 2020] S. Jannicke Moe, Anders L. Madsen, Kristin A. Connors, Jane M. Rawlings, Scott E. Belanger, Wayne G. Landis, Raoul Wolf, Adam D.Lillicrap (2020).Development of a hybrid Bayesian network model for predicting acute fish toxicity using multiple lines of evidence. Environmental Modelling & Software, Vol 126, April 2020. https://doi.org/10.1016/j.envsoft.2020.104655
[Lillicrap et al. 2020] Adam Lillicrap, S Jannicke Moe, Raoul Wolf, Kristin A Connors, Jane M Rawlings, Wayne G Landis, Anders Madsen, Scott E Belanger (2020). Evaluation of a Bayesian Network for Strengthening the Weight of Evidence to Predict Acute Fish Toxicity from Fish Embryo Toxicity Data. Integrated Environmental Assessment and Management. https://doi.org/10.1002/ieam.4258
[Madsen et al, 2013] Madsen, A. L., Karlsen, M., Barker, G. C., Garcia, A. B., Hoorfar, J., Jensen, F (2013). A Software Package for Web Deployment of Probabilistic Graphical Models. In Proceedings of the Twelfth Scandinavian Conference on Artificial Intelligence (SCAI), pages 175-184.
Useful references for those interested in BBN include:
[Kjærulff and Madsen, 2013] Kjærulff, U. B. and Madsen, A. L. (2013) Bayesian Networks and Influence Diagrams: A Guide to Construction and Analysis. Springer, Second Edition.
[Madsen et al, 2014] Madsen, A. L., Jensen, F., Karlsen, M., Soendberg-Jeppesen, N. (2014). Bayesian Networks with Function Nodes. In Proceedings of European Workshop on Probabilistic Graphical Models (PGM), pages 286-301.
Disclaimer
HUGIN EXPERT A/S takes no responsibility whatsoever for examples and information in examples published on this web site. ALL EXAMPLES ARE FOR DEMONSTRATION PURPOSES ONLY.