A Bayesian network model to predict fish acute toxicity from multiple lines of evidence
By: Jannicke Moe, Raoul Wolf and Adam Lillicrap (Norwegian Institute for Water Research)
WWW: Anders L Madsen
April 2019
Latest update: April 2020
Bayesian networks (BNs) are gaining popularity in ecotoxicology and ecological risk assessment, because of their ability to integrate different types of data and other information, and to predict the probability of specified states. This example demonstrates the use of a Bayesian network to provide scientific support for decisions on animal testing in ecotoxicology. European legislations require Reduction, Replacement or Refinement of animal testing wherever possible. The use of fish embryos for toxicity testing is considered a promising alternative to the use of juvenile or adult fish. However, fish embryos are not yet accepted as an alternative for regulatory purposes. The European Chemicals Agency (ECHA) has therefore recommended the development of a weight-of-evidence (WoE) approach to evaluate Fish Embyo Toxicity (FET) data in combination with other types of information as a replacement for juvenile fish toxicity data.
We have developed a probabilistic WoE model: a BN to predict the acute toxicity of a substance to juvenile fish based on four lines of evidence (Figure 1). The purposes of this online demonstration version are:
- To demonstrate the functionality of the model by the example substances given below
- To let users predict juvenile fish toxicity for new substances by entering their own data.
- To get feedback from users for improvement of the tool.
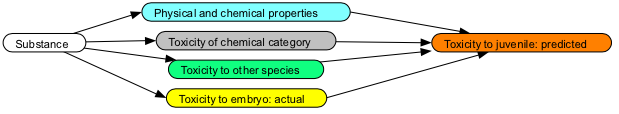
Figure 1.
The four lines of evidence are based on of the following input nodes (Figure 2).
- Physical and chemical properties of the substance:
- Hydrophobicity (the octanol-water partition coefficient, Kow): low (<5.5) or high (>5.5)
- Molecular weight (g/mol): low (<= 600) or high (>600)
- QSAR (quantitative structure-activity relationship): 5 toxicity levels (Table 1)
- Toxicity of the substance's chemical category (to juvenile fish)
- Chemical category (select from the list)
- Toxicity of the substance to other species (algae and Dapnia)
- Toxicity to algae: 5 toxicity levels (Table 1)
- Toxicity to Daphnia: 5 toxicity levels (see Table 1)
- Ratio of toxicity to Daphnia/algae: low (<0.5), medium (0.5-2) or high >2
- Toxicity of the substance to fish embryo
- Observed toxicity to fish embryo: 5 toxicity levels (Table 1)
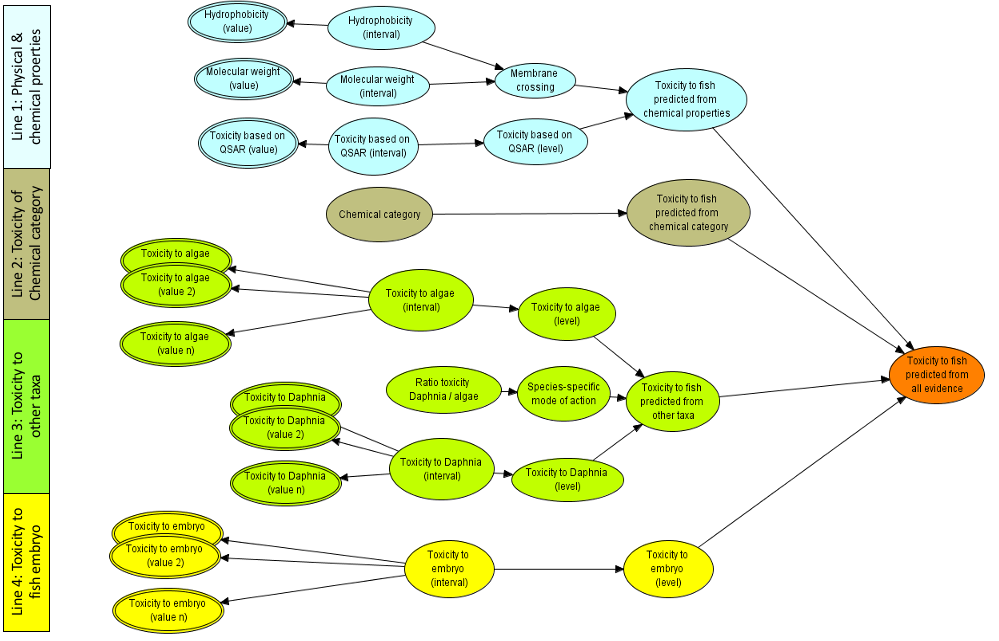
Figure 2.
The levels of all toxicity nodes are defined by the following intervals of LC50 or EC50 values:
| Toxicity level | Lower concentration (mg/L) | Upper concentration (mg/L) |
|---|---|---|
| very low | 100 | inf |
| low | 5 | 100 |
| medium | 0.5 | 5 |
| high | 0.01 | 0.5 |
| very high | 0 | 0.01 |
The four lines of evidence are weighted equally in this version in the model. The development, testing and validation of the model are further described by [Moe et al., 2020].
For a given chemical substance, please enter the substance name and the requested values for each of the input nodes. Up to ten values can be entered for each of algae, Daphnia and fish embryo. After entering all values, press Compute.
The model predictions will be displayed on the next page (Results).
An example can be loaded at the bottom of this page (Load Case).
In case of an error message, reload the page (it may be necessary to enforce a complete reload, e.g., on Windows using ctrl-F5).
Substance
Substance name (chemical):
Enter data
Line 1. Physical and chemical properties of the substance
Line 2. Chemical category of the substance
Line 3. Toxicity of the substance to other taxa (algae and Daphnia)
Please enter toxicity values as EC50 (mg/L).
Select number of values for toxicity to algae
Select number of values for toxicity to Daphnia
Line 4. Toxicity of the substance to fish embryo
Please enter toxicity values as LC50 (mg/L).
Select number of values for toxicity to embryo
Example
An example for the substance carbamazepine can be loaded using the button below. The model correctly predicts that the toxicity to juvenile fish most likely is low (52% probability), although the measured toxicity to embryo is very low. In this example, the assessment based on the BN model with four lines of evidence is closer to the actual toxicity to juveniles, than an assessment based only on measured toxicity to embryos would be.
Conclusions
The toxicity level of to juvenile fish is most likely (% probability).
The probability that fish acute toxicity of will be medium or higher (LC50 < 5 mg/L) is %.
The measured endpoint most sensitive to is .
Computed probability distributions
Line 1: Physical and chemical properties of the substance
Line 2: Toxicity of the substance's chemical cateogory
Line 3: Toxicity of the substance to other taxa (algae and Daphnia)
Line 4: Toxicity of the substance to fish embryo
Result: Predicted toxicity to juvenile fish
The View input values button provides a table of the entered values, and some values calculated directly from these.
The View output values button provides a table of the predicted probability distributions for selected nodes, as displayed on this page.
The tables can be copied and pasted e.g. into an Excel sheet.
Acknowledgements
We thank Scott E. Belanger, Kristin Connors and Jane Rawlings (Procter & Gamble) for providing data and knowledge for constructing, testing and validation of the model, and Wayne Landis (Western Washing University) for contributing to development of the model.
This work was supported by NIVA's research programme DigiSIS (New digital methods for monitoring and research).
Contact Information
For further details on the paper: Jannicke Moe at jmo(at)niva(dot)no
For further details on the use of Bayesian networks and web deployment of models, contact: Anders L Madsen at alm(at)hugin(dot)com
References
[Moe et al. 2020] S. Jannicke Moe, Anders L. Madsen, Kristin A. Connors, Jane M. Rawlings, Scott E. Belanger, Wayne G. Landis, Raoul Wolf, Adam D.Lillicrap (2020).Development of a hybrid Bayesian network model for predicting acute fish toxicity using multiple lines of evidence. Environmental Modelling & Software, Vol 126, April 2020. https://doi.org/10.1016/j.envsoft.2020.104655
[Lillicrap et al. 2020] Adam Lillicrap, S Jannicke Moe, Raoul Wolf, Kristin A Connors, Jane M Rawlings, Wayne G Landis, Anders Madsen, Scott E Belanger (2020). Evaluation of a Bayesian Network for Strengthening the Weight of Evidence to Predict Acute Fish Toxicity from Fish Embryo Toxicity Data. Integrated Environmental Assessment and Management. https://doi.org/10.1002/ieam.4258
[Madsen et al, 2013] Madsen, A. L., Karlsen, M., Barker, G. C., Garcia, A. B., Hoorfar, J., Jensen, F (2013). A Software Package for Web Deployment of Probabilistic Graphical Models. In Proceedings of the Twelfth Scandinavian Conference on Artificial Intelligence (SCAI), pages 175-184.
Useful references for those interested in BBN include:
[Kjærulff and Madsen, 2013] Kjærulff, U. B. and Madsen, A. L. (2013) Bayesian Networks and Influence Diagrams: A Guide to Construction and Analysis. Springer, Second Edition.
[Madsen et al, 2014] Madsen, A. L., Jensen, F., Karlsen, M., Soendberg-Jeppesen, N. (2014). Bayesian Networks with Function Nodes. In Proceedings of European Workshop on Probabilistic Graphical Models (PGM), pages 286-301.
Disclaimer
HUGIN EXPERT A/S takes no responsibility whatsoever for examples and information in examples published on this web site. ALL EXAMPLES ARE FOR DEMONSTRATION PURPOSES ONLY.