Wiki-Page for Technical User Guide
Interactive guidance document on the use of the Bayesian network and its web-based interface (Work in Progress)
Technical User Guide
The purpose of this user guide is to explain to the user how the SWiFT weight-of-evidence platform can be used to predict fish acute toxicity from multiple lines of evidence. The purpose of this part of the documentation is solely to demonstrate and explain how the user interface works. The purpose is not to explain the underlying theory or how the model works.
The analysis of a substance using SWiFT platform has four main steps:
- Upload data to the system
- Validate the uploaded data
- View the results
- PDF-report generator
It is assumed that the user has the data for the analysis available and is able to enter this data into the system either manually thorugh the input dialog or (preferred option) to organize the data using the XLXS template file for upload (XLSX template file).
It is important that the data follows the format used in the template and the example files. The decimal separator (also known as radix point or radix character) must be dot. That is, dot is used to separate the integer part of the value from the fractional part.
After uploading the data, the user can enter author name and author organisation using the input fields shown below:
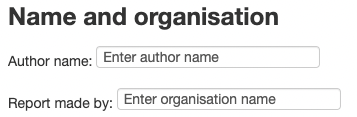
This information is used in the PDF-report that can be generated based on the results of the calculation.
Upload data to the system
To upload a data file (using the XLSX template file), you need to press the Browse button. Once the button is pressed a File dialog where the input file can be selected appears. Use the File dialog to lcoate and select the input file that you want to use. Once the File is uploaded, a new dialog showing the content of the file will appear.
For the example, file Carbamazepine - XLSX file the dialog showing the content of the file will look like the figure below.
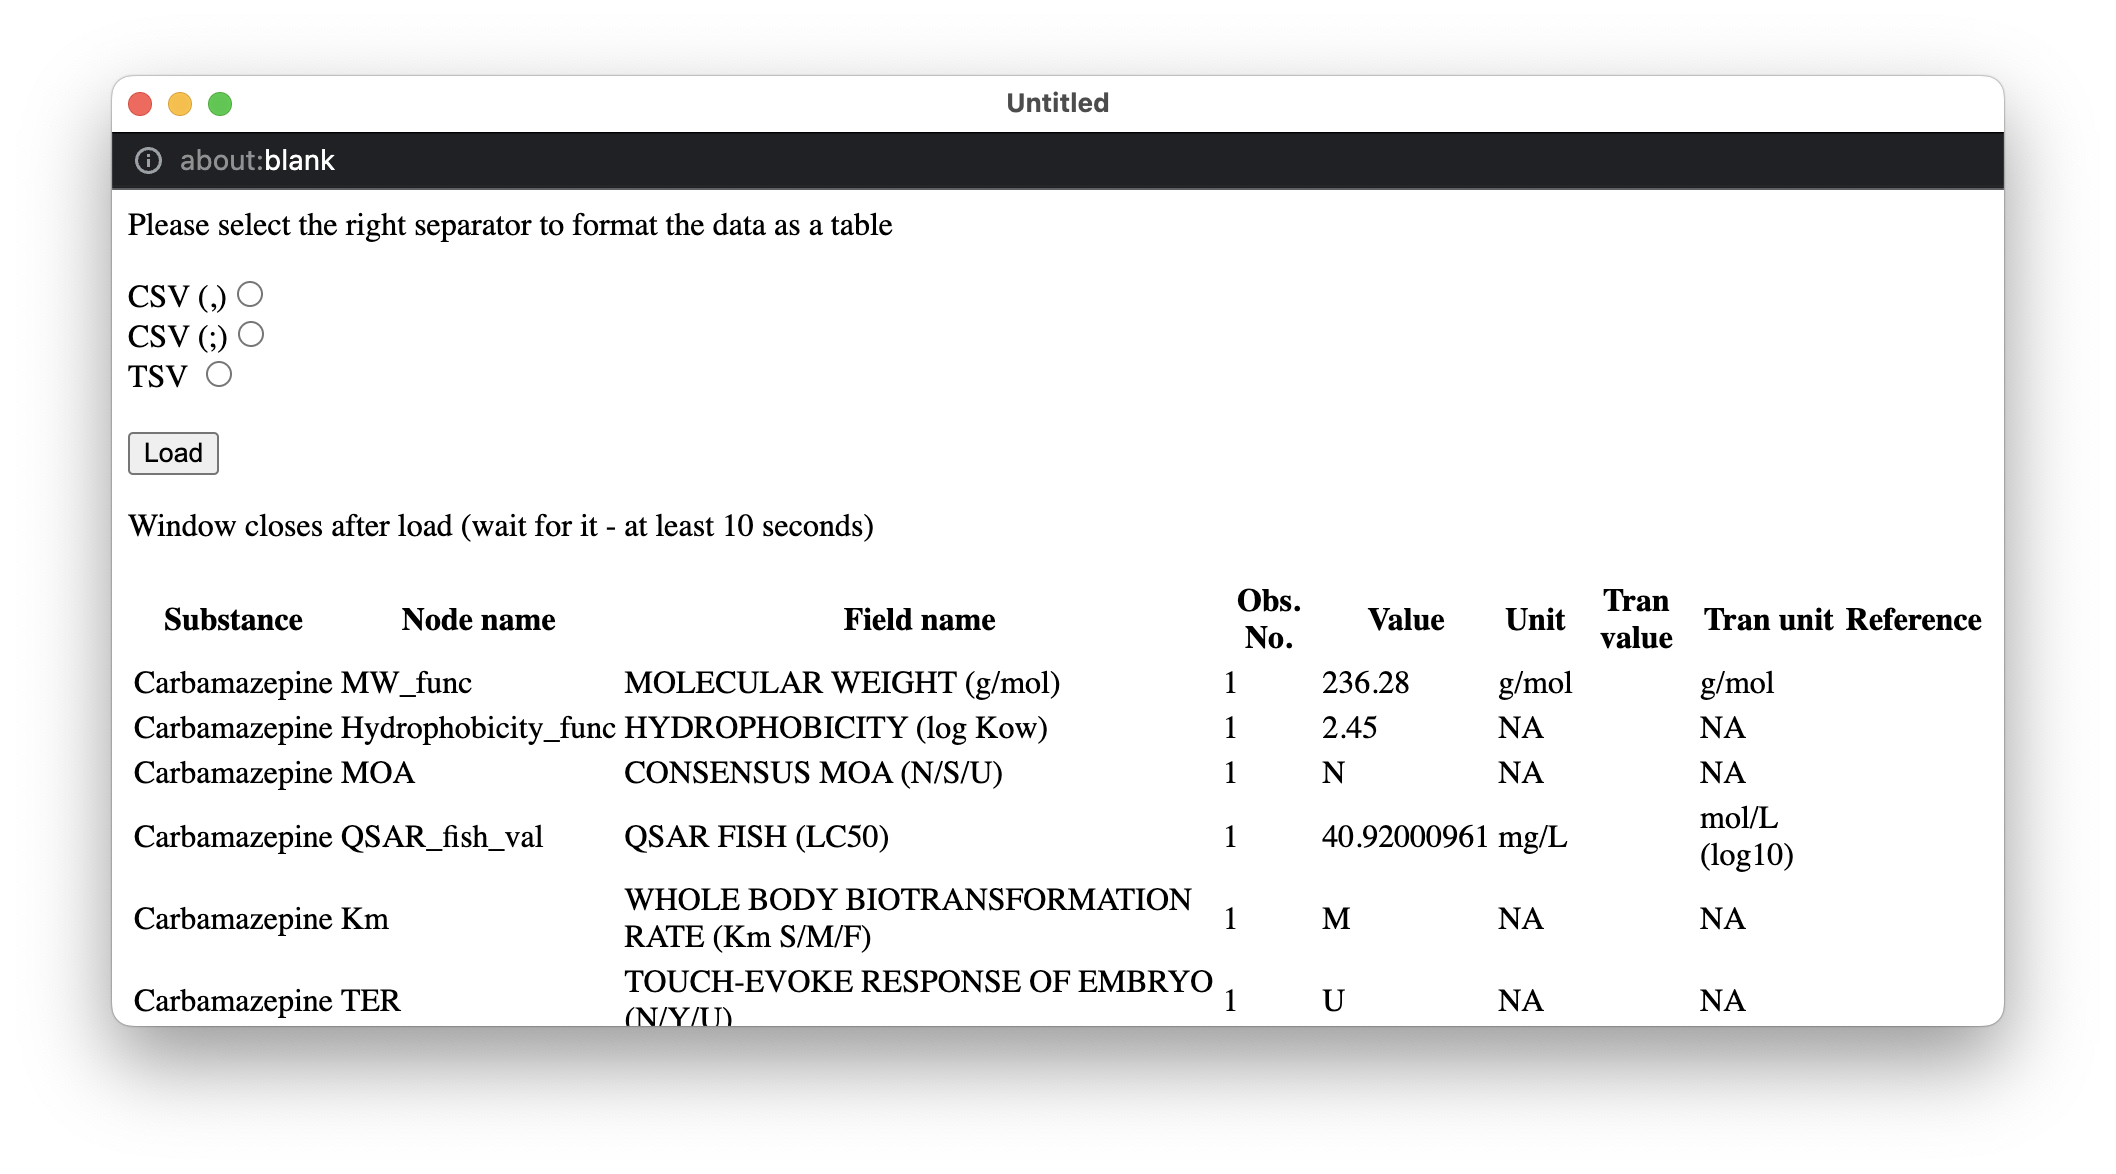
Here it is very important to follow the instructions to select the separator symbol used in the file otherwise the data will not be loaded correctly and the system will fail. In this example it is clear that the separator symbol is ';'. Once this separator symbol is selected the formatting of the data changes and will appear as illustrated below.
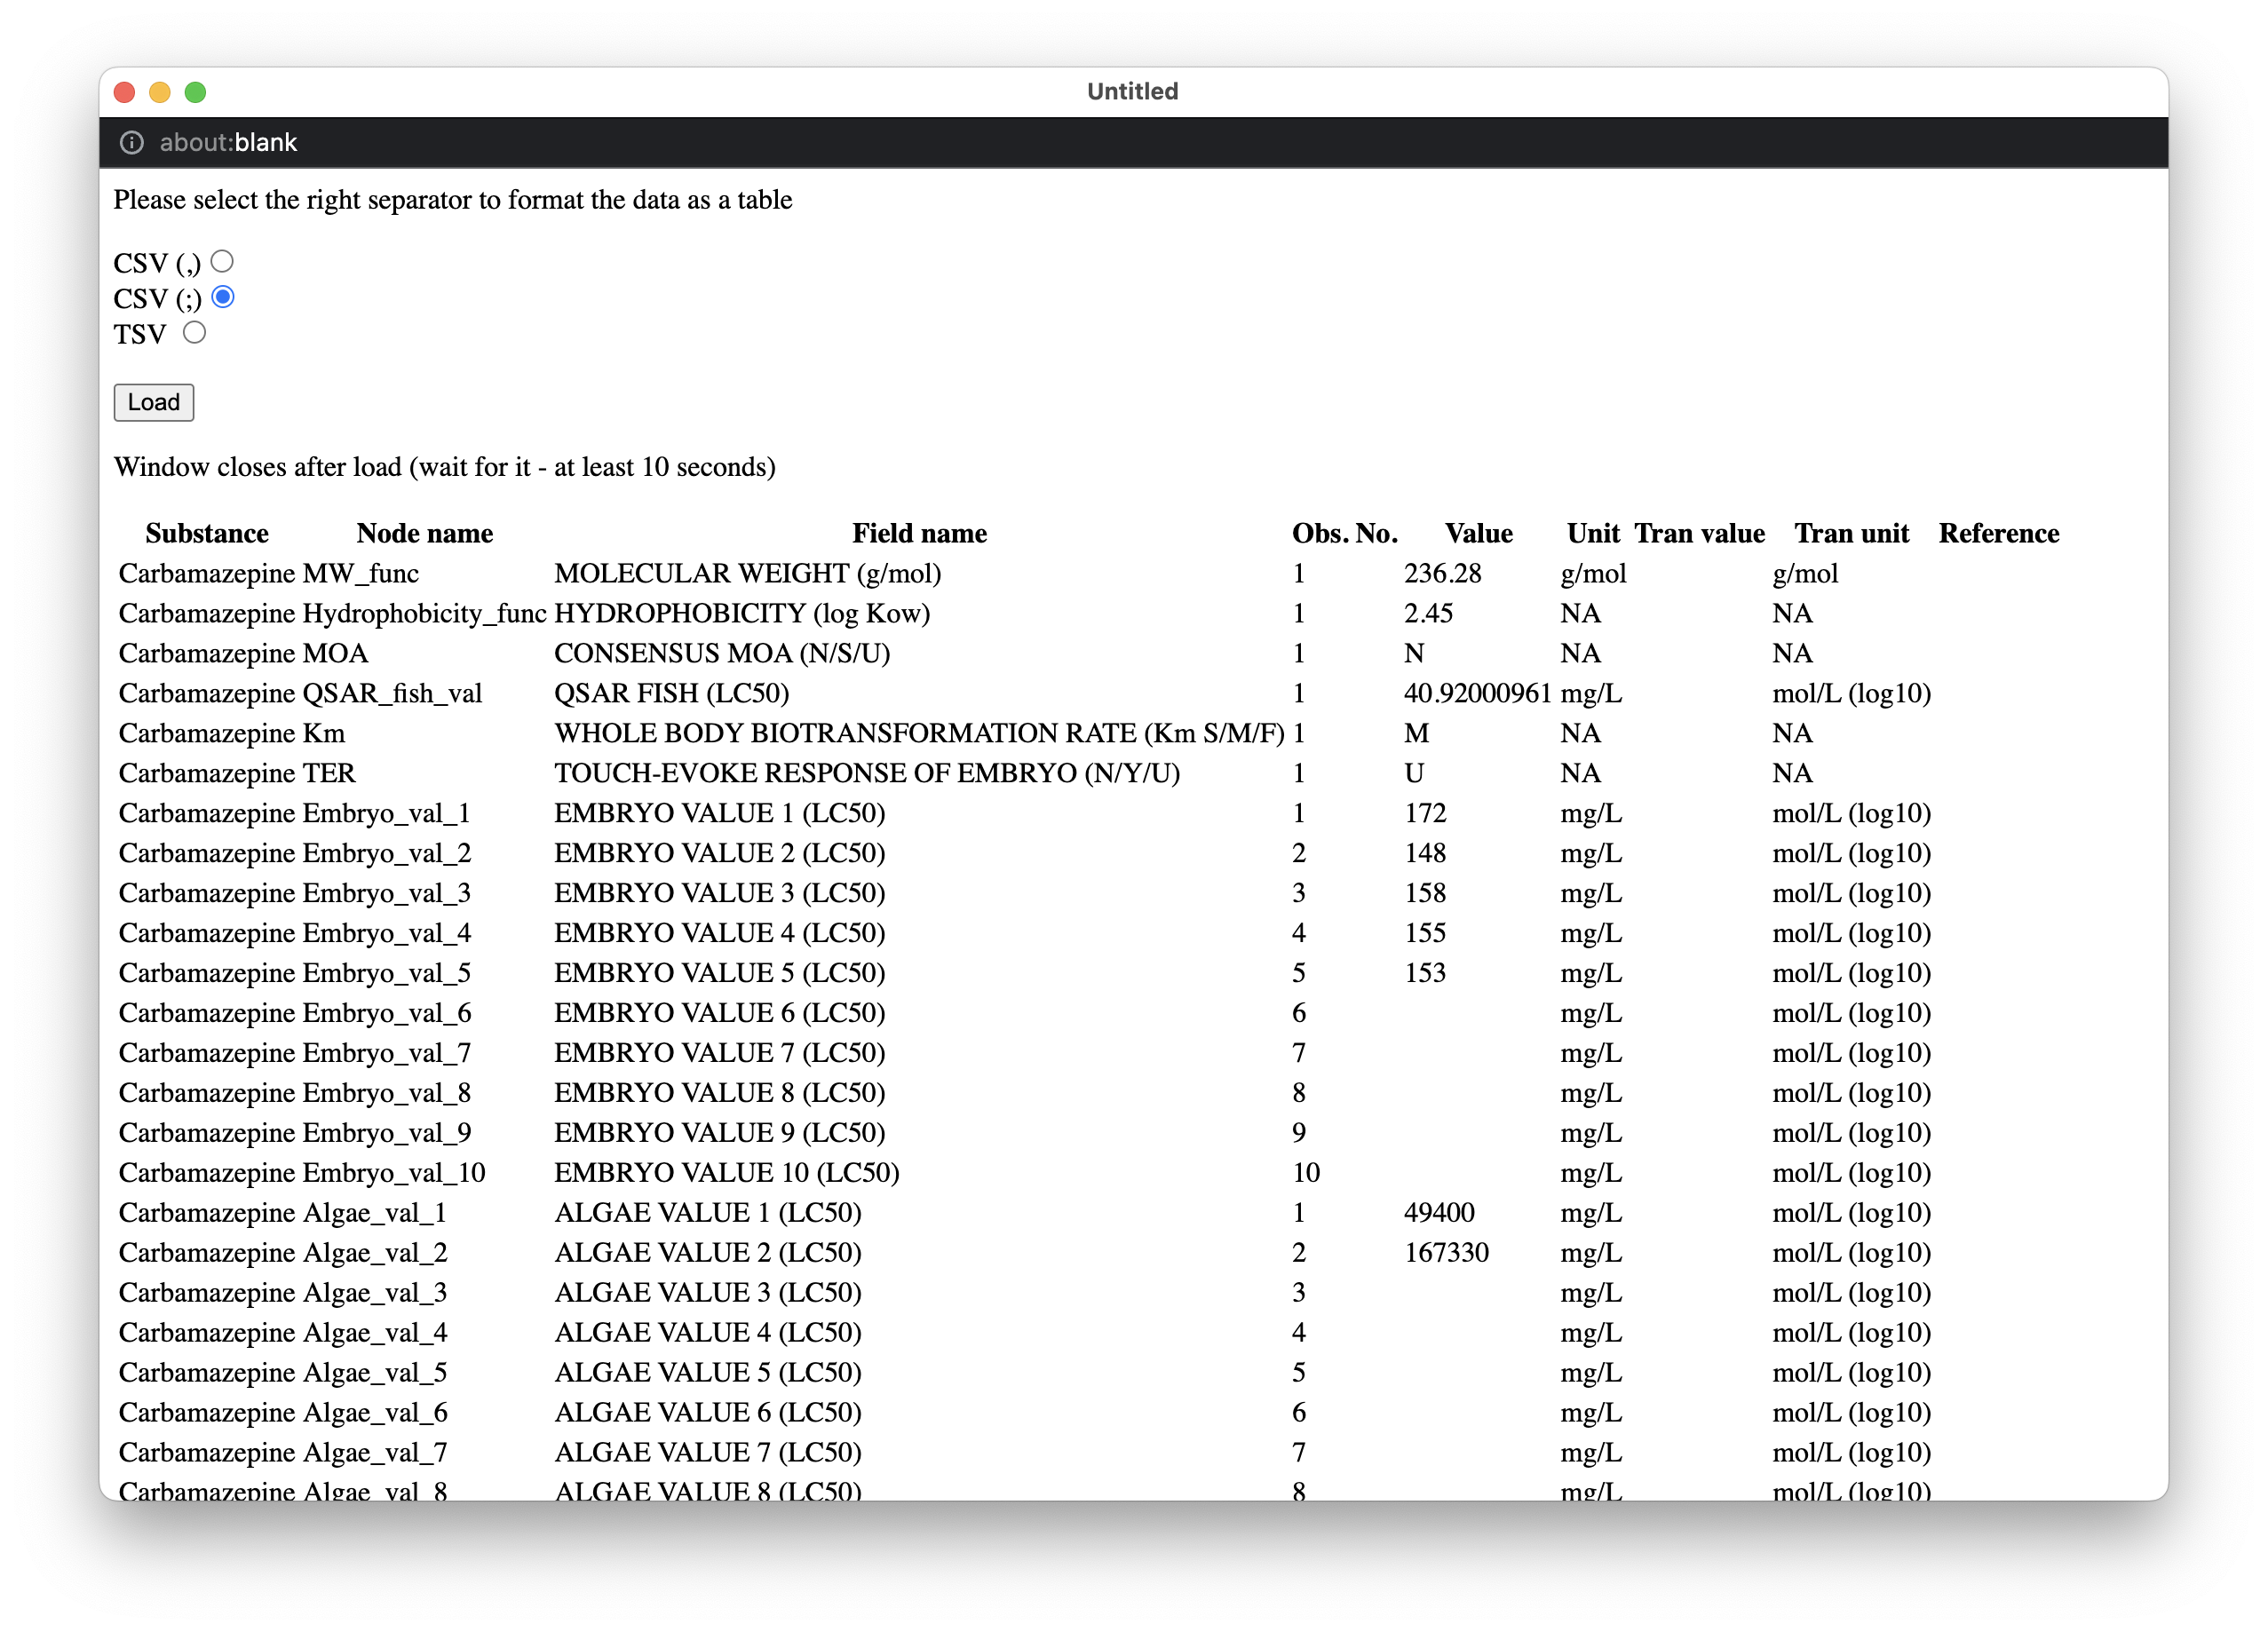
It may be necessary to navigate to the bottom of the dialog to locate the Load button again. Once the data is formatted correctly, the Load button should be pressed. Once this button is pressed the data in the input file is uploaded to the server. This may take a LONG time in the current implementation. Please be patient and wait for the window to close.
As can be seen from the above figure, the data contains five 5 observations on Embryo, two values on Algae and two values on Daphnia.
Once the data upload process is complete the substance name Carbamazepine is displayed in the input field for the substance name.
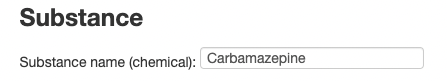
Please note again that the upload process may be quite long depending on the speed of your internet connection.
To make it easy for the user to try the system on already existing data, we have included four buttons where each button represents a separate example.

Each button represents an example.
Notice: The data is sent to the server for calculations, but the data is not stored. Once the Reset button is pressed, the data is removed from the model.
Validate the uploaded data
Once the data is uploaded, the validity of the upload and the transformation of the data can be determined by navigating to the Show entered data tab of the web-site.
The figures below show the pages with entered data as well as values derived directly from the entered data (e.g., the substance group). For all toxicity values (EC50 and LC50) the values are shown after transformation to the scale mol/L (log10).
Users are not supposed to enter or change values on the pages. It is mainly to check that the values have been correctly entered into the system.
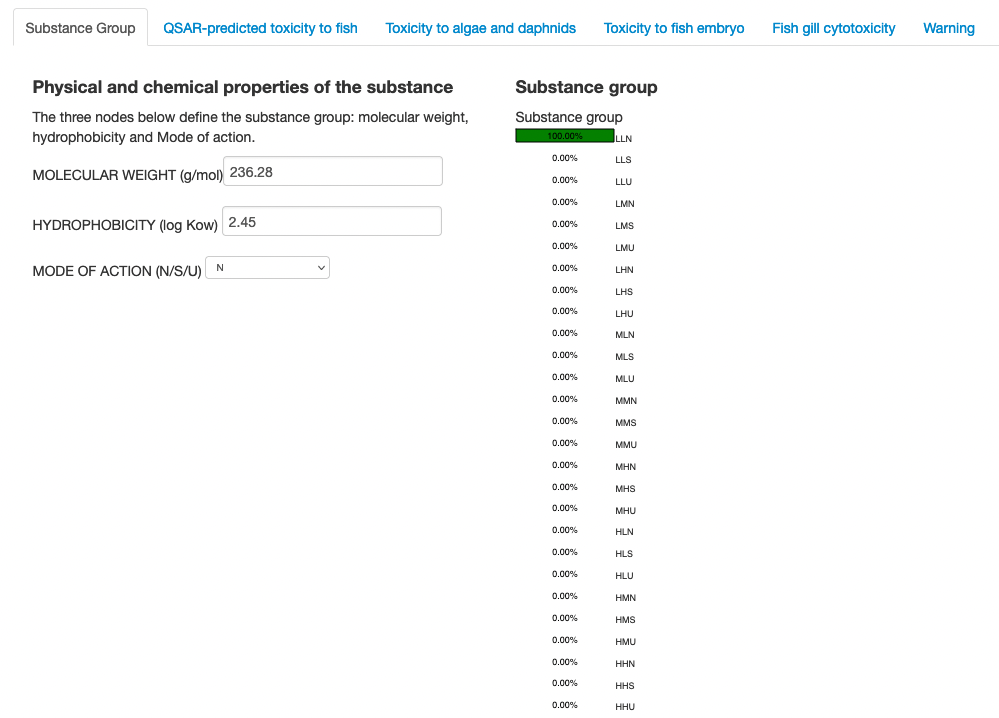
The below data shows the data to determine the substance group based on the physical and chemical properties of the substance.
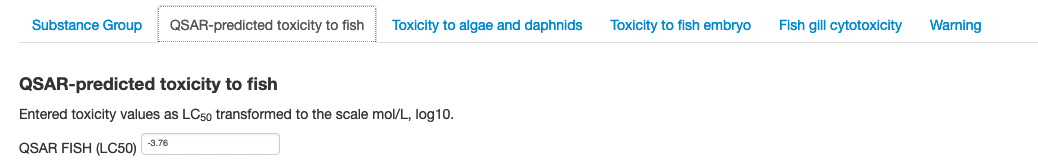
The next figure shows the data on QSAR-predicted toxicity to fish.
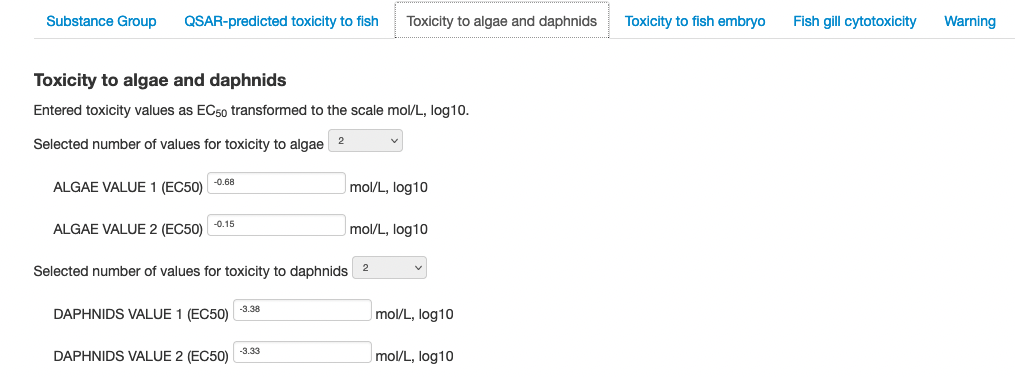
The next figure shows the data on toxicity to algae and daphids. It is clear that two values are available for algae and two values are available for daphnids.
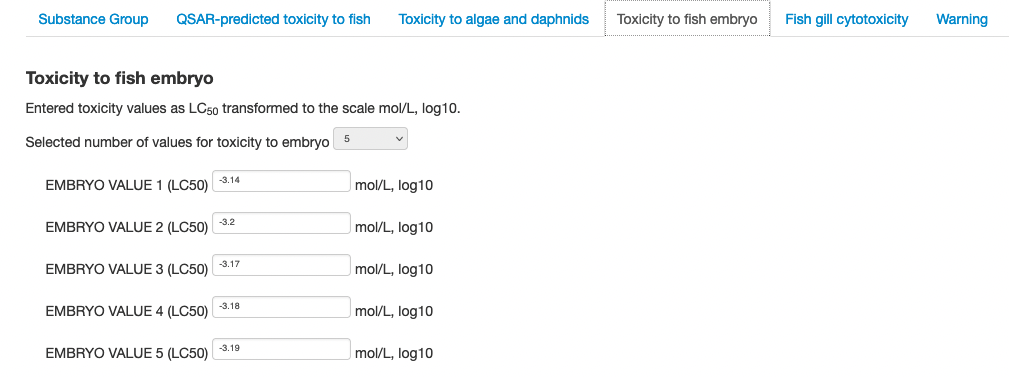
The next figure shows the data on toxicity to fish embryo where five values are available.
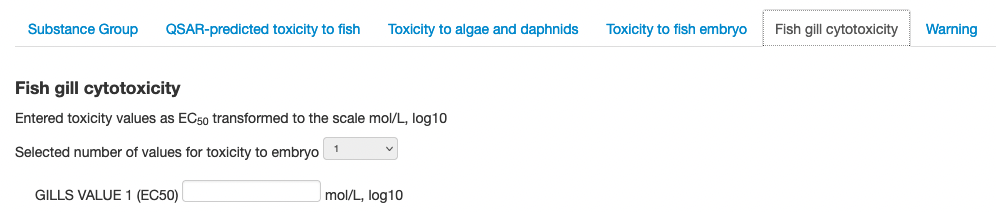
The next figure shows the data on toxicity to fish gill cytoxicity where one value is available.
The next figure shows the warning conclusion based on the warning factors.
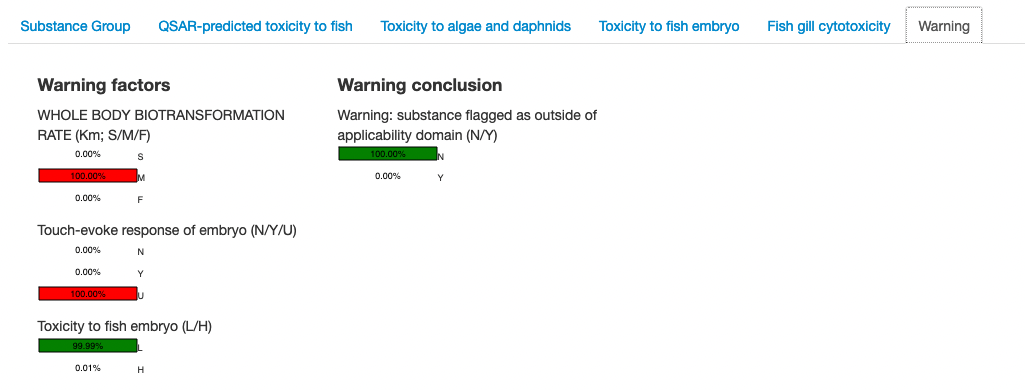
The warning conclusion indicates if the substance is flagged as outside of the applicability domain of the underlying model.
Results
This page is where the results of the analysis are shown to the user. There are different pieces of information that are relevant to consider and a number of opportunities to get additional details.
The information on the page also goes into the PDF report that can be generated.
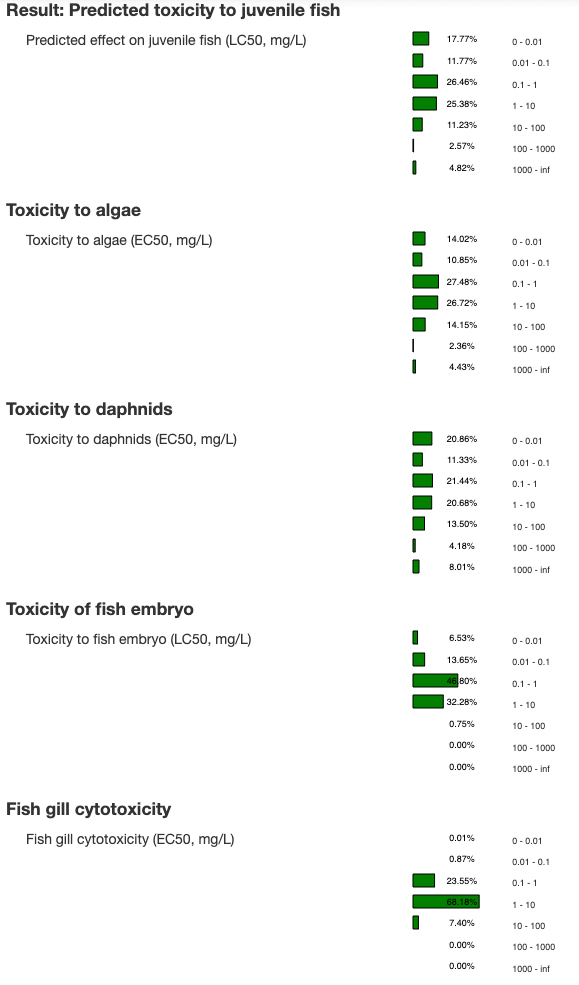
The top part of the page shows the main conclusions from the analysis as shown in the figure below.
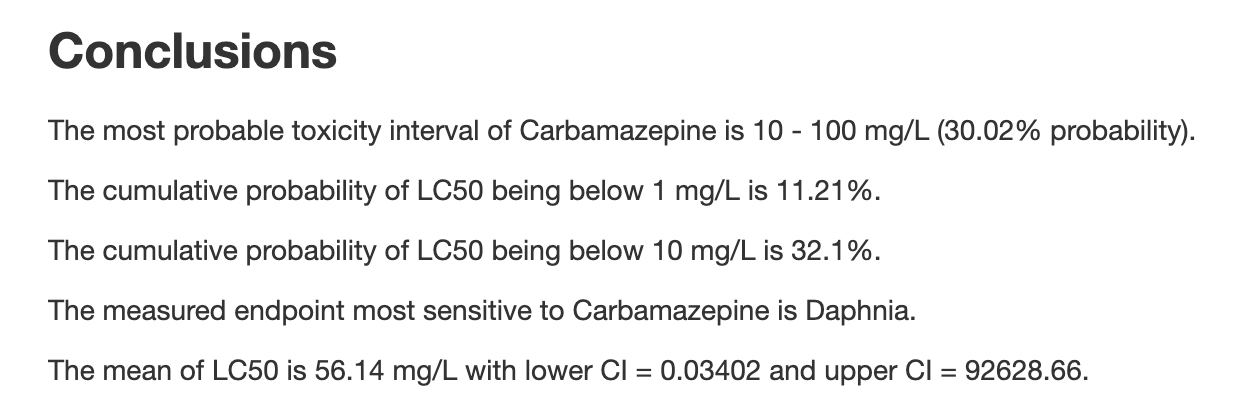
This figure shows the most probable toxicity interval of the substance as well as the probability of the LC50 being below two different fixed thresholds and the measure endpoint most sensitive to the substance.
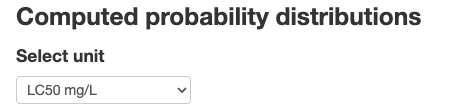
As a default the computed probability distributions are show for the variables in unit LC50 mg/L, but the user can change the unit to LC50, mol/L, log10 using the select box shown above.
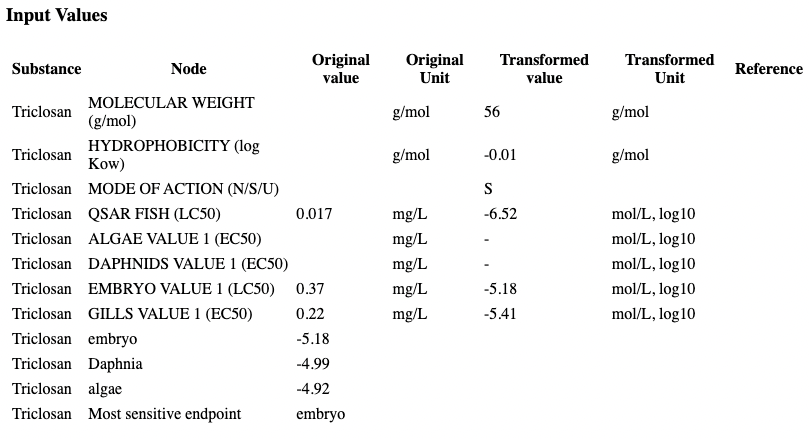
Below are three buttons that the user can press to open a dialog window showing the input values, a dialog window showing the output values, or a dialog window showing a Pdf report with the results of the analysis.

The figure below shows the dialog window with input values.
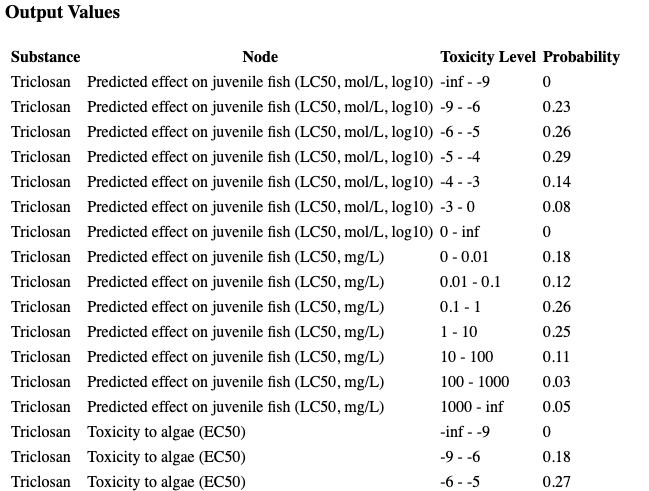
The figure below shows the dialog window with output values.
PDF-report generator
The results of the calculations can be store in a PDF-report. The PDF-report is generated when the user presses the Download PDF report button shown below. The button is located at the bottom of the page entitled Results.

The first page of an example PDF-report is shown below.
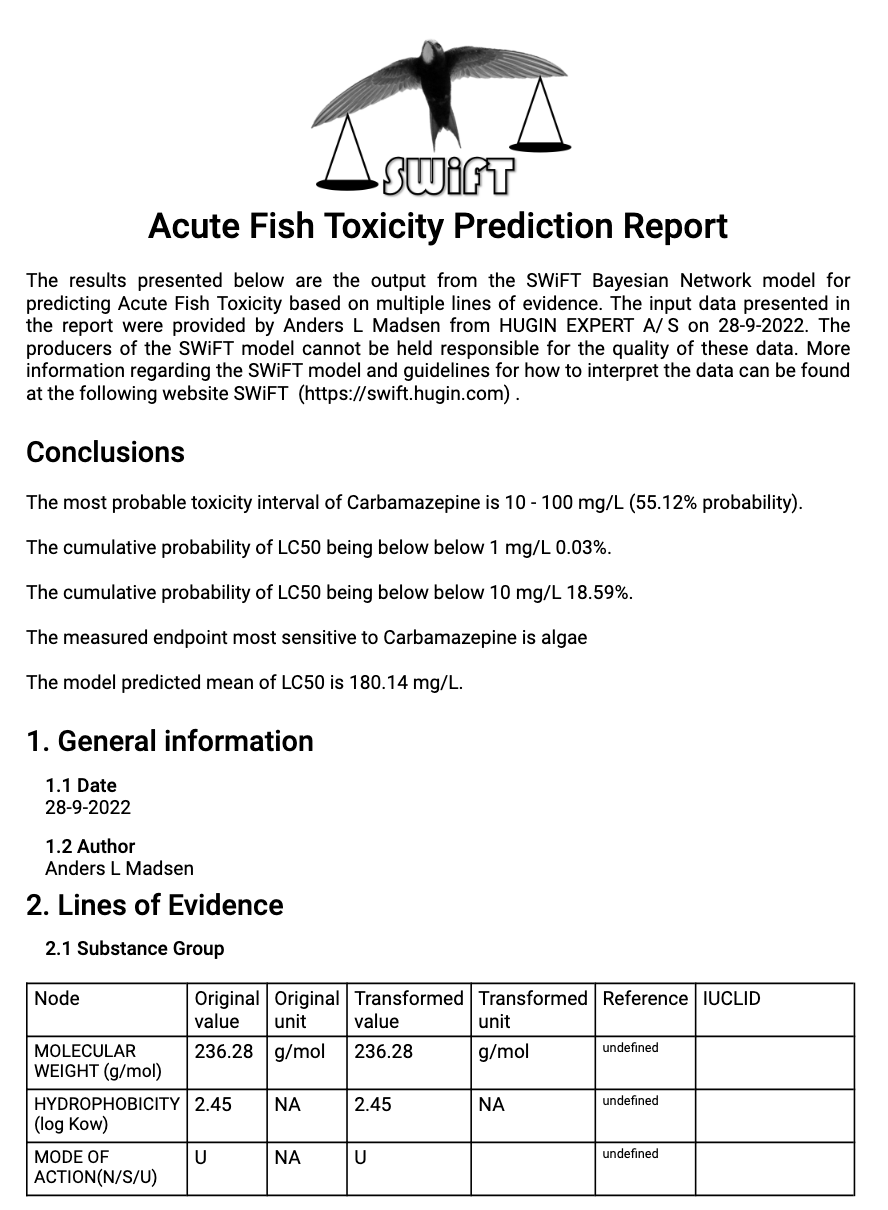
Please note that the entire content of the PDF-report is not included in the figure shown above.
The content of the PDF-report is based on the data entered to the system and the results of the calculations. In addition, to this information the PDF-report also includes the author name and organisation as well as the date of the day when the report was generated. Any information on references uploaded is also included in the PDF-report in the last column of the tables. Please note that these PDF-files are not stored and should be saved to the users own file saving system.
Dictionary of Terms
Bayesian network
A Bayesian network is a probabilistic graphical model representing a joint probability distribution over a set of variables.